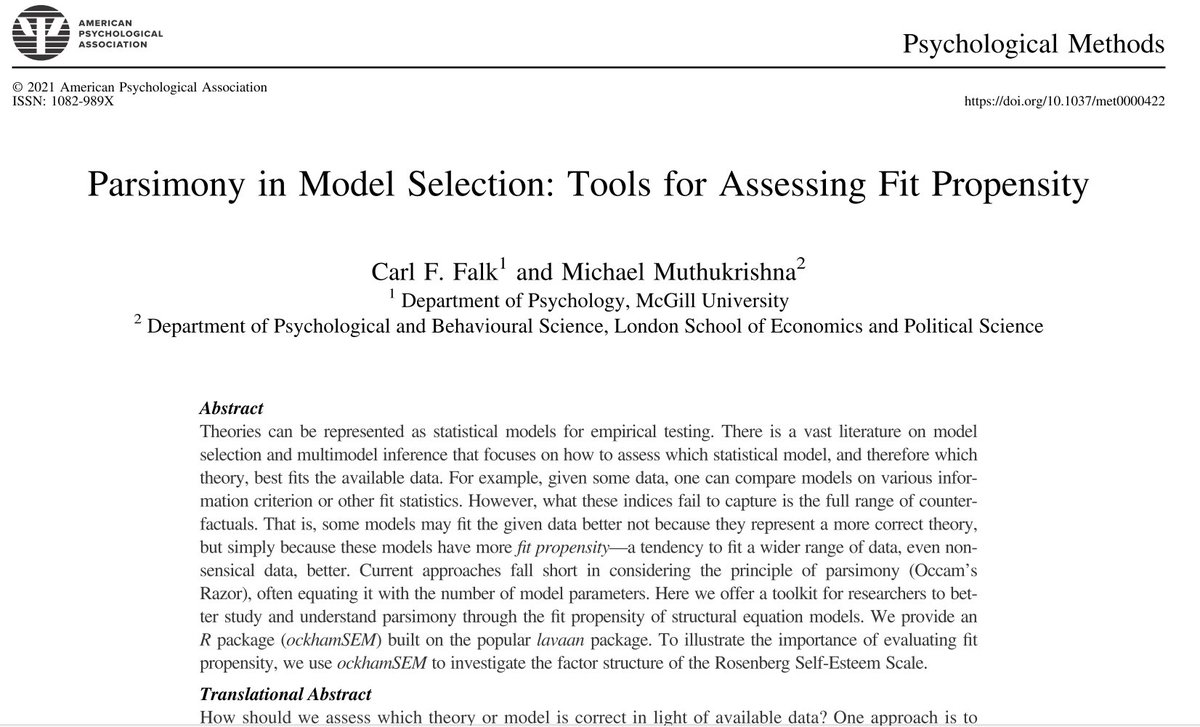
This is a summary from a Twitter thread about a new article on “Parsimony in Model Selection: Tools for Assessing Fit Propensity” with Carl Falk in Psychological Methods. Paper available at muth.io/parsimony21.
🚨New paper (& #RStats pckg) in Psych Methods: “Parsimony in Model Selection: Tools for Assessing Fit Propensity” w/ Carl Falk
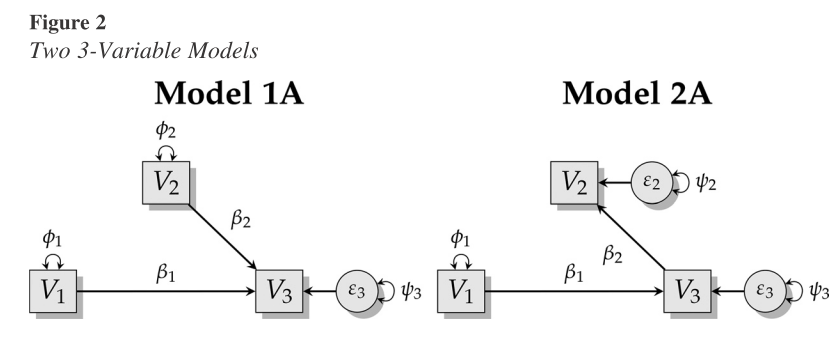
Say you have 2 theories rep in 2 stats models. Which theory/model is correct? The one that best fits the data right?
Ok, but what about parsimony?
Occams razor: given 2 equally fitting models, all else being equal pick the simpler / more parsimonious, model. But how do you quantify parsimony?
Some researchers equate parsimony with degrees of freedom, but as we show you can have fewer parameters, but less parsimony.

Another way to think about it is what Kris Preacher called “fit propensity”. Some models may fit the given data better not because they represent a more correct theory, but because they would fit any data better. Even nonsensical data. It’s the opposite of parsimony.
Incidentally, the context for this research is the theory crisis and the importance of formalizing theory, even if in a statistical model. More here:
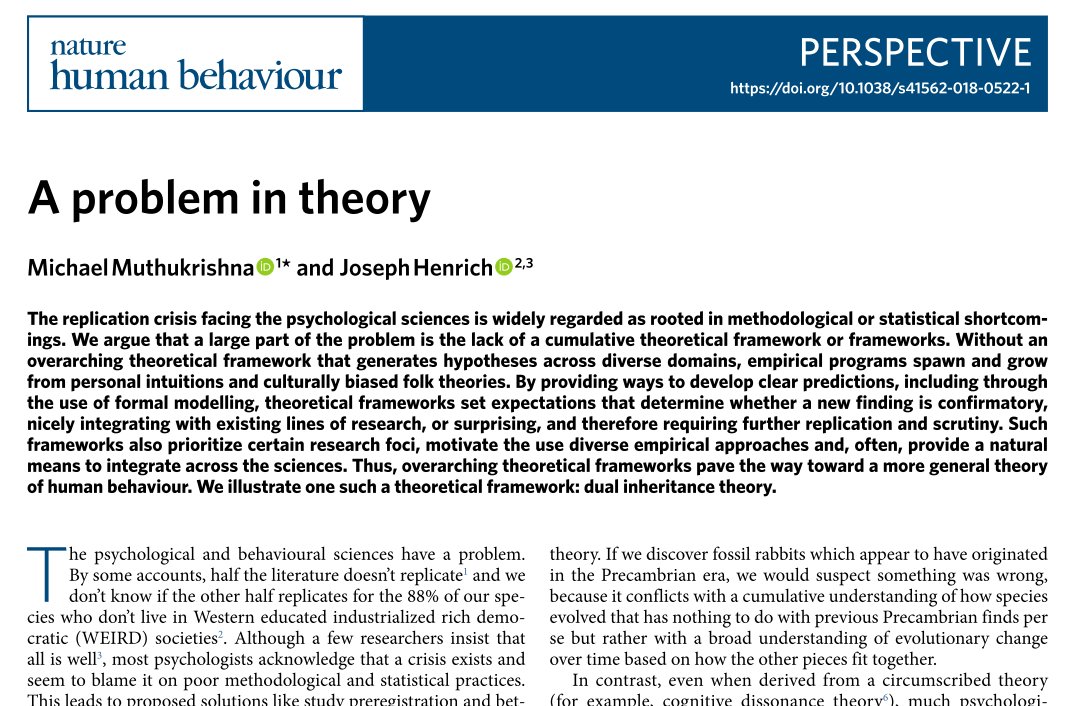
New paper: we argue that the replication crisis is rooted in more than methodological malpractice and statistical shenanigans. It’s also a result of a lack of a cumulative theoretical framework: & (nature.com/articles/s4156…)(muth.io/theory-nhb)
Back to fit propensity.
Fit propensity is often ignored in model selection. Perhaps because the answer to “how do we assess fit propensity?” has been “not easily”. In this paper, we fix that.
We offer a toolkit and 5 step process for researchers to assess parsimony of SEMs using an R package (ockhamSEM).
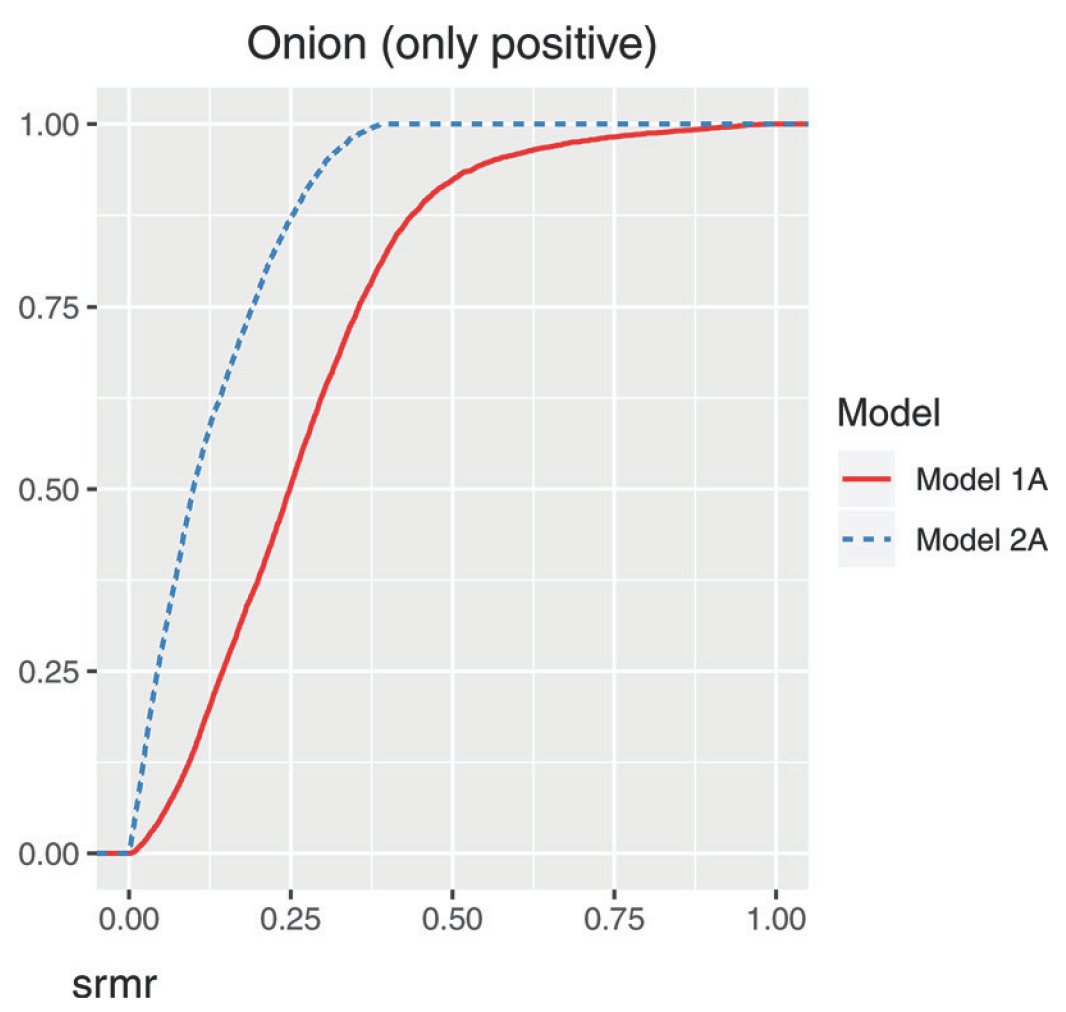
Basic idea: generate random data (or constrained random data, e.g. only positive) as covariances and see which model fits better in this universe of nonsense.
So in the opening model, using standard model selection approach, you might conclude that 2A is a better model than 1A. 2A has a lower AIC so it’s the best theory for generating the data, etc. But you’d have ignored that 2A lacks parsimony.
2A fits a wider range of data better – even nonsense.
Between these models, you might think the factor model is a better fit than the simplex model, but it lacks parsimony – much more so if the data are all positive covariances!
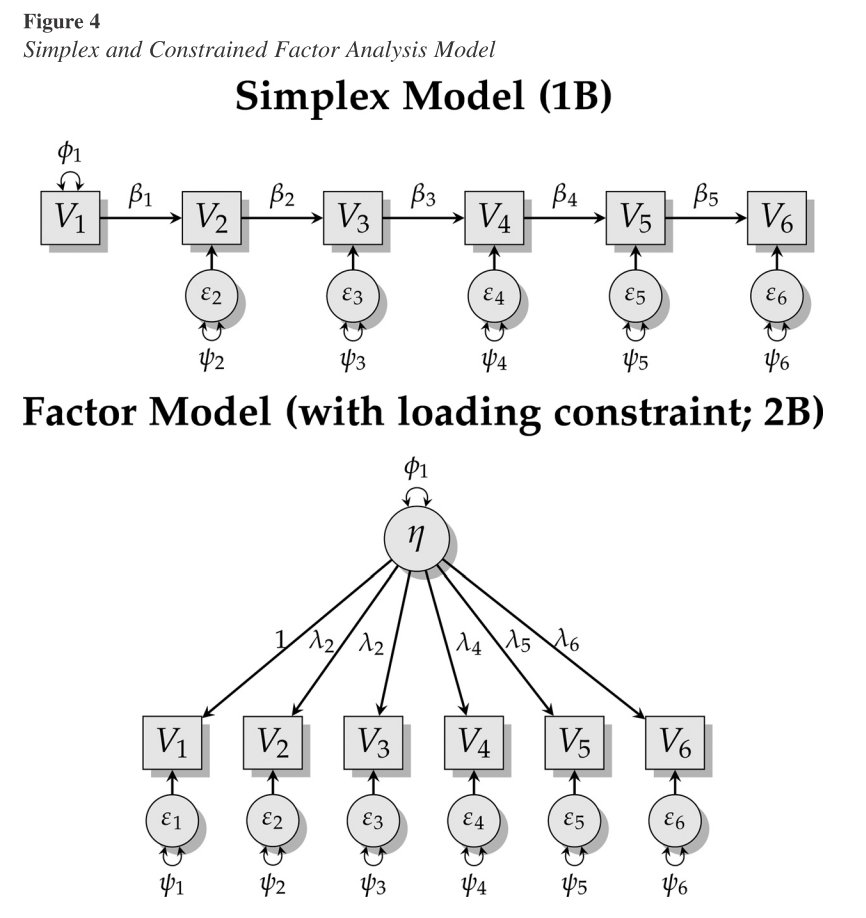
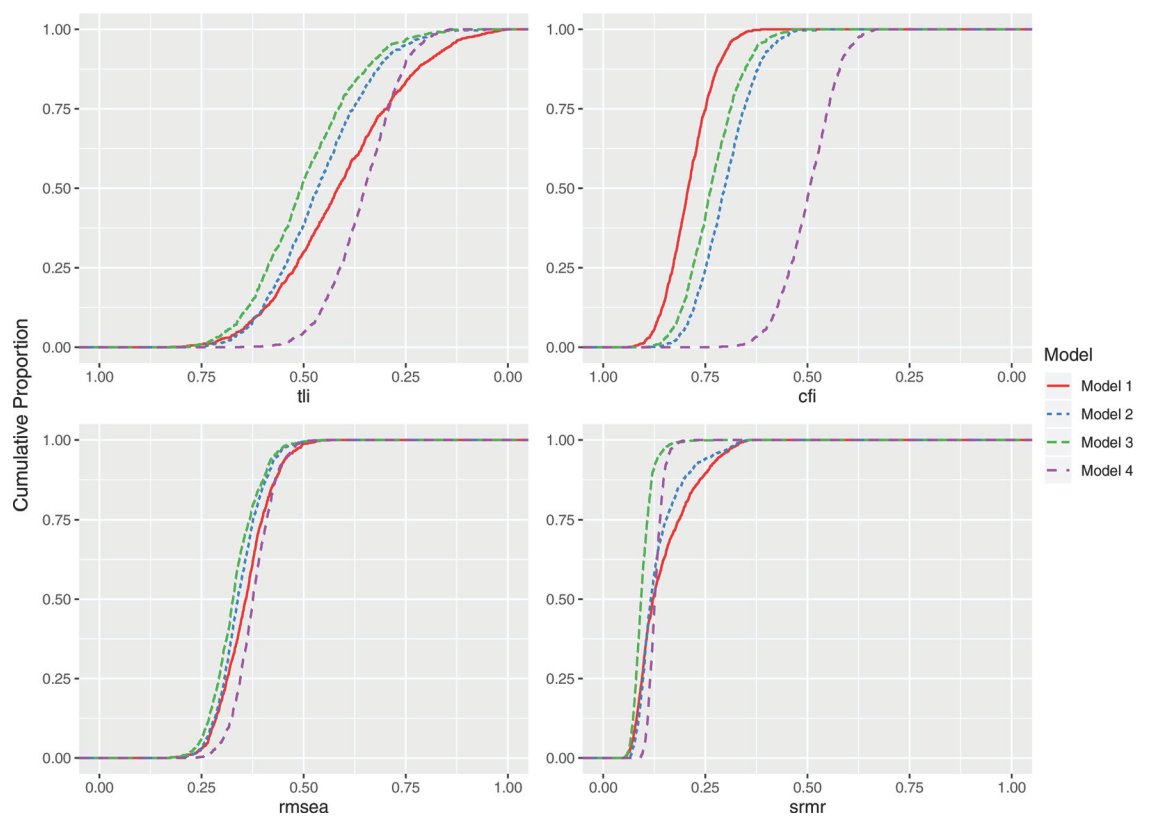
To show some of the complexities of considering parsimony, we investigate the factor structure of the Rosenberg Self-Esteem Scale.
Spoiler: fit indices interact with fit propensity.
ockhamSEM package:
More details in the paper:
(muth.io/ockhamsem) (psycnet.apa.org/record/2021-92…) (muth.io/parsimony21)


